
We enabled new sections in Belvo’s dashboard to help our customers to easily debug all elements related to recurrent links. We will cover the main sections with detailed explanations about how to use them and concrete examples.
When we started Belvo, our mantra was: “Built for developers, by developers” because it’s the developers that make the magic happen. Whether it be integrating with a new product, improving the design, or debugging issues. And even though we’re only three years old, we haven’t been idle: we listen to feedback, talk to developers, and try to find ways to make the frustrations a bit less, well, frustrating.
That’s why we’ve recently released a whole set of features in our dashboard that’ll help you debug customer issues even faster. But before we dive into the features, let's just cover some of the more common issues we’ve heard from you.
Debugging basics
The most common things we hear from you are:
- Our users can't see their data in our application!
- Our users noticed their data aren’t being refreshed and they just report it to us.
- Ummm, how can I know how many links, and with which bank, we have?
So - how can you figure out what the issue is? Well, let’s walk you through our new dashboard features.
Table of Contents
Deep dive into the new features
Links
So, your user can’t see their data in your application? Well, the first step is to check whether or not they actually connected their account successfully. And that couldn’t be easier with our Links section.
| Remember: A link is basically a connection between your user and their banking institution. So, if your user has accounts in three different banks, they’ll have three different links associated with them. To keep things organized (and know which links belong to the same user), we really recommend you give them an external_id. |
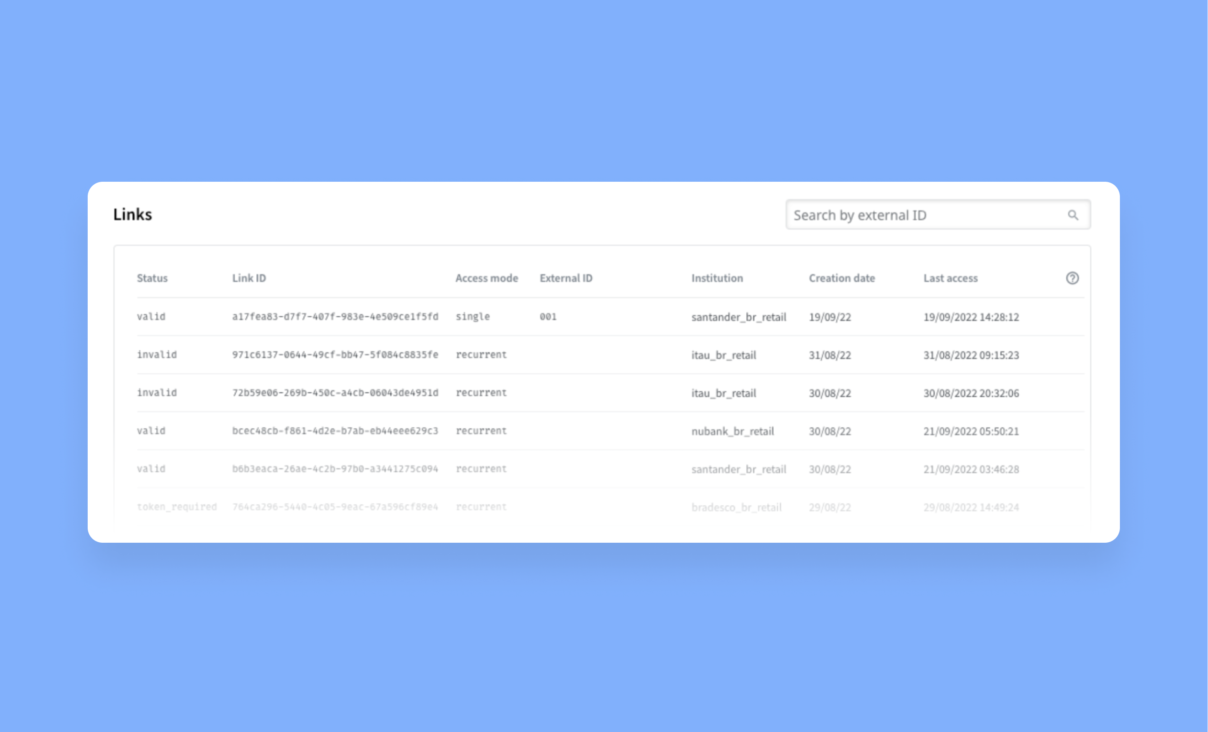
Links are a set of credentials that are associated with a user when they access a financial institution, therefore the link_id within Belvo’s ecosystem is their unique identifier. In this dashboard section, you can find the following fields:
- Links created: with a unique identifier, the id,
- Status: it can be valid, invalid, token required, etc,
- Access mode: recurrent or single link,
- External id: when you are building the integration is up to you use an external_id as an internal identifier or not, but according to our best practices, you must use it,
- Institution: the name of the institution that this link belongs,
- Date created: the date the link was created,
- Last access: the last time you made a call to that link.
Your end-users are complaining that your platform is not showing their data, and they don't know why. A good way to use our dashboard as an interactive tool is to go to the Links section, and research by that specific link with their link_id (new feature) and external_id as well (as we said before, it is very important to use this unique identifier).
Then you go check the status of that link: if it is valid, check the latest access date and you will be able to see if we are returning the data and the last day the customer received it.
From there we can also verify if the token is updated, which means if the status is token_required, the end-user won't be able to see its data, so they’ll need to update the token first. Then, the status will be valid and the end-user can re-check its data. Remember that if you click on a link, you can also check the latest API calls, the events related to that link, and more data.
Logs
With this section we are able to see all the different logs and every request. We can filter by time period, endpoints, institutions, method, source, status, and response code. You can even search by link_id, request_id or external_id.
Your end-users get a 428 error, they are panicking and suddenly you receive a lot of notifications, they are all trying to reach out to you. Keep calm and go to the Logs section in the dashboard. From there you will be able to filter by:
- Link_id
- External_id
- Request_id
- Date
Then, you will be able to see the following fields:
- Response (response code, for example: 200, 201, 400, 428, 500, etc)
- Method (GET, POST, PATCH, PUT or DELETE)
- Endpoint (the endpoint that logs belong to)
- Datetime (the date day/month/year and the time according to your timezone)
From there, you can investigate why they’re getting this specific error and/or how you can help them to solve it because you have access to the full response body with the following data:
- Code (for example: login_error)
- Message (for example: invalid credentials provided to login to the institution)
- Request_id (a unique identifier for that request)
This is an error response JSON example (we don’t show successful ones as they might include sensitive data):
{
"code":"token_required",
"message":"A MFA token is required by the institution to login",
"request_id":"3dc204d7ef12ff4f71152ad807307f19"
}
If you still can’t identify what is causing the error or you have a doubt about how to proceed, send us a ticket via the help center with the request_id and we’ll give you a hand!
Events
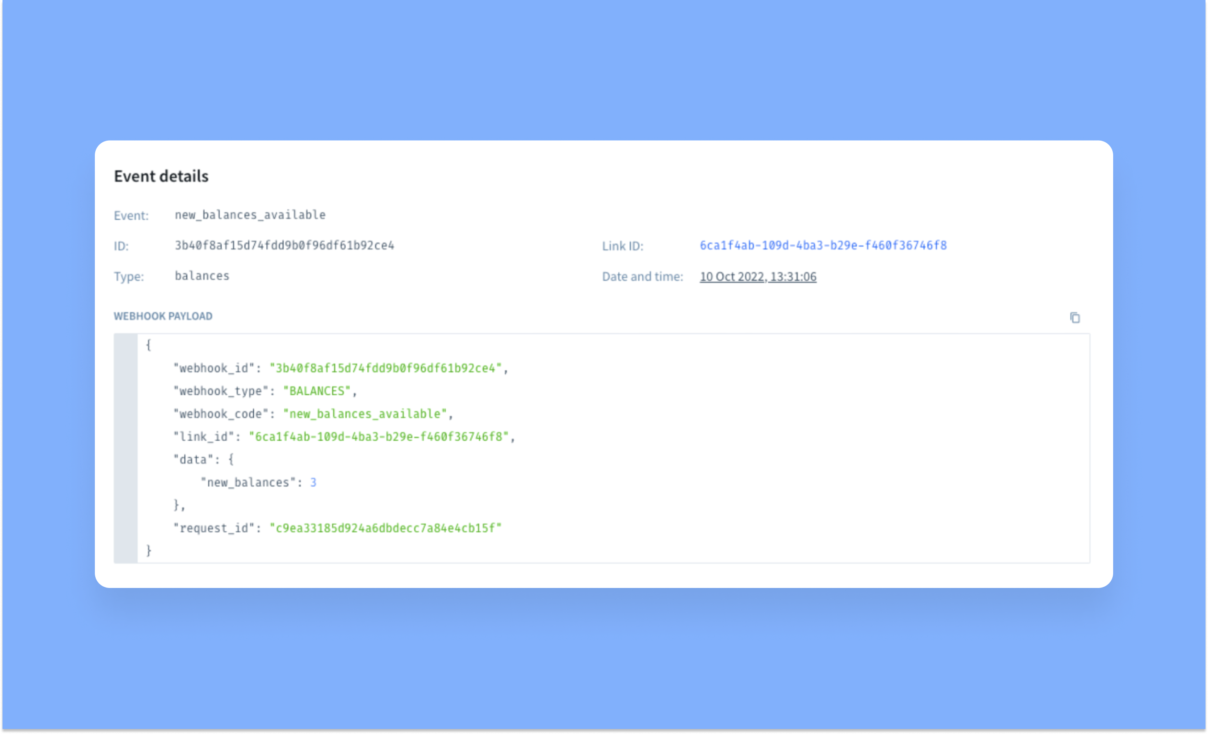
Another interesting section of the dashboard is: Events. Here, you can find the webhooks that have been sent to your application when we received new information. For example, there are new transactions available for that particular link_id, you will receive the event new_transactions_available.
The most common events you can encounter for the links are: historical_update, new_transactions_available, new_accounts_available, new_balances_available, which are related to data, and related to authentication, you have: invalid_credentials and token_required.
For more detailed information about a specific endpoint, visit our developer portal.
Your end-user receives an error message about a token_required. This error can happen only with institutions that require 2FA (two-factor authentication) as you will only be able to create your link after passing the token. But for some reason, you didn't receive any webhook event on your platform. Don't worry, you can log into the dashboard, go to the Events section, and you will see the latest webhook events sent or you can search for a specific one. Then you will be able to see if the event is there, and if so, you’ll see the following data:
- Type: which endpoint it belongs to,
- Event: name of the event describing the exact message or error message,
- Webhook id: the unique identifier of the webhook,
- Link id: the link that this webhook belongs to,
- Datetime: the exact date and time the event was sent.
You can obtain more detailed information related to an Event if you click on it. For example, the event name, the type (related to the endpoint), the link id, date and time, the payload and the attempts, with the response code, webhook URL and datetime.
Insights
This section is more related to internal management rather than customer requests. But it’s still relevant to help you better manage your integration with Belvo because you will be able to see:
- The most common errors (428 - token_required, 500 - internal server error),
- The endpoints more consumed (such as transactions and balances, if you use our Banking product for example),
- How many requests were made,
- How many links (recurrent and single) were created in the last 30 days and if it matches with your integration (it also works for valid links).
A good example is when you have more links created than you thought, but not all of them are valid. If it’s the case, you can manage if all the links created are valid by relying on the following information:
- Links created,
- Requests made (for POST and Patch requests),
- Active links,
- Filter by a period of time,
- Institutions, methods (GET, POST, PATCH, PUT, and DELETE),
- Responses codes (ie. 200, 201, 204, 400, etc),
- Endpoints.
Another scenario is that you are receiving many errors but you want to precisely identify which institution is returning these errors and/or how many errors you are receiving for a specific institution and check if the error is internal (from Belvo’s connections) or external (from the institution directly).
And last but not least, we are thrilled to announce our latest solution: Lending Analytics 🎉 Through Belvo’s dashboard, lenders can now access and visualize raw data and enriched insights directly from their users’ accounts without writing a single line of code. Try it now!